Contact Support
Urgent issues and troubleshooting items should be sent to support@qnopy.com or call 1-866-QNOPY-24.
Table of Contents
1. General – How to Get Started
- Introductory video
- How to get your user account, overview, navigating the mobile app, starting an event, data entry, refresh button
- Viewing and editing data, printing data, sending data reports to the project manager
2. Project Setup
- Creating a project, adding new forms, adding field points to your project, uploading defaults, limits, and location filters
- Starting an event from the web app
General – How to Get Started
Introductory Video
See all tutorial videos here.
How to get a User Account
- To have a user account created, send an email to support@qnopy.com requesting a new user account. Once an account has been created for you, you will receive an email with your username and password. You can use this username and password to access the QNOPY mobile app, as well as the QNOPY web portal.
Overview – the Flow of QNOPY
- To start using the QNOPY app for you data collection, first you will need a project. Once a project is created, you then have the ability to assign the forms that are necessary, for example, a groundwater monitoring form. After this, you can assign users to the project. Once the project is created, forms are assigned, and users are assigned, you are able to use the forms by starting a field event.
Navigating the Mobile App
- My Events: Shows all active and closed events.
- My Projects: Shows all projects you are assigned to.
- Calendar View: Shows any active or closed field events by date.
- Tasks: Shows any active or completed tasks for all projects.
- Project Folder: Located in each event, the project folder holds any documents that would be beneficial to the project, added by the project manager.
- Hospital Map: Can be used to quickly navigate to the closest hospital. Click on the H in the top right corner to instantly know where to go.
- Draw: Can be accessed in every site location. Draw gives you the ability to quickly make a note on a picture that was captured or even on aerial site images.
Field Events
- Field event in QNOPY represents an actual on-site field event such as a second-quarter groundwater monitoring event at a site. Under this event, if you record sampling data for 25 monitoring wells then all that data is given a unique Event ID in the QNOPY database.
- Events allow you to keep data for an actual event together and print all of it at once. You can record sampling data for a field point at multiple times during a year and separate it under field events.
Start a New Event from the Mobile App

- To create a new event on the QNOPY app, click on the plus button.
- Select a project from the list. Additionally, you can search for a project in the ‘Search Project’ bar at the top.
- Name the event – naming an event is not mandatory, choose the Event Start Date and Event End Date, then click ‘Start Data Entry’
Data Entry
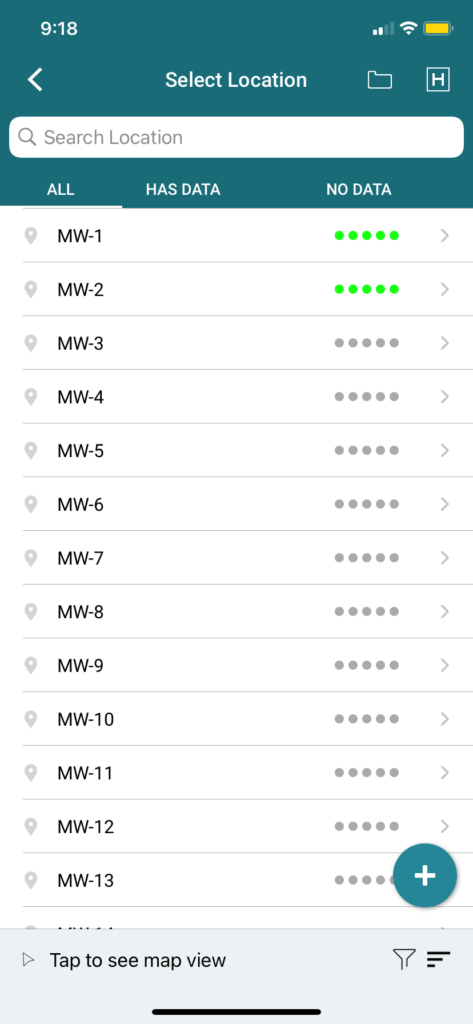
- Data entry is straight-forward and simplified through the QNOPY web app. By clicking on a field event, you can start your data collection. In your field event, you will see all locations for that event. You can filter site locations based on which have data entered by clicking ‘Has Data’ or “No Data’ near the top of the page. Green dots will additionally show which locations have data.
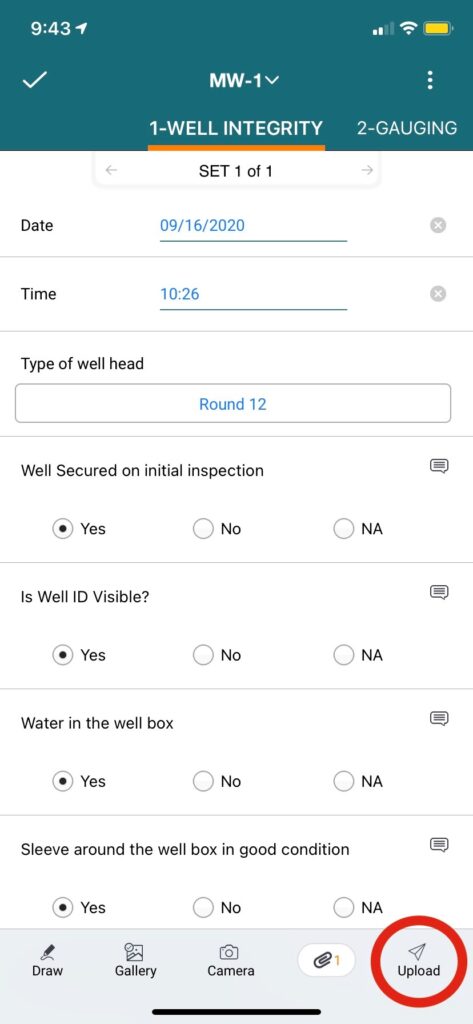
- When choosing a location, the form for the event will be shown. If the form has multiple sections, you can scroll through the sub forms at the top of the page, or click on the name of the location at the very top and go to the desired sub form.
Refresh Button and Uploading Data
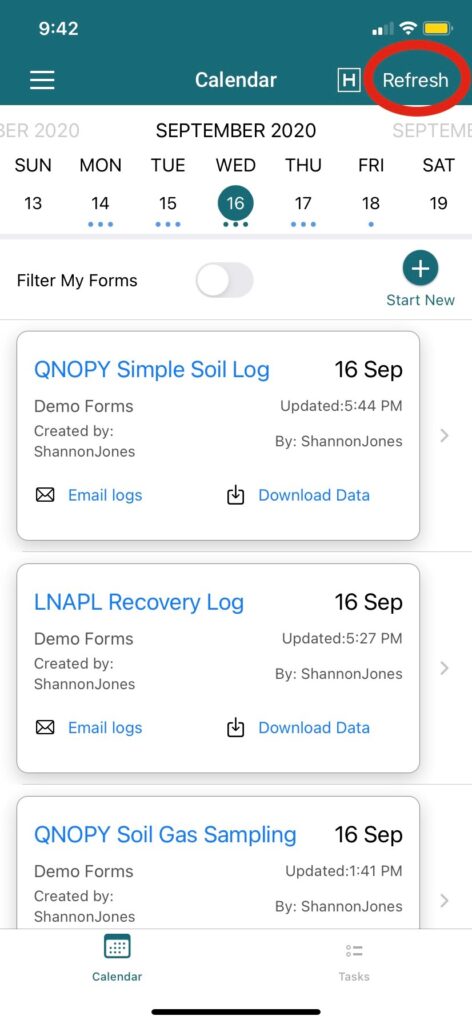
- The refresh button can be found on the Calendar View page in the top right corner. Refresh is used to update any changes that may have been made to the forms.
- The upload button can be found inside each location in the bottom right corner. Since the QNOPY web app works completely offline, upload is used to upload data and upload pictures. It is important to remember to upload your data whenever available.
Sending Reports to Project Managers
- Reports can be generated in the QNOPY web app and emailed to project managers. In the Calendar View, each form has the option ‘Email logs’. By clicking on this, you will be given three options: (1) View Report, (2) Send PDF file, and (3) Send DOC file.
Field Data
- Once data is synced from the app, you can view it in the grid view
- You can do the following from the field data page:
- Export Data to Excel
- Edit Data in grid view
- Edit Data in Mobile Form view
- Print Field Data
- View Photos/Generate Photolog
- View Photos on the map
Edit Data in Tabular View
- From the field data or Live Data (Grid) page click on down arrow next to the

- Then click on Edit Data
- You can delete the entire row by clicking on:
 button
 - Click on
 to change the Field Point or Location in case data was entered under a wrong point.
 - Click on the blue text to edit any of the values you want and then
 to save your changes

Edit Data in Form View
- On the Live Data, page click on the Mobile Forms option in the top right corner
- Select field event from the dropdown list
- Select field point to enter/edit data
- You can select a sub-section to edit data on the left-hand side

- You can add multiple sets of data by clicking on

- Fill in data and click on

- You have multiple options to see

- who entered data for the form,
- Export to Excel
- Print Field log
- Approve data
- View pictures attached to the form
- and Upload photos for the form

Print Field Logs from Event Dashboard Page
- Click on the action button next to the event
- Select Print Data
- Save the PDF log to your computer
- A PDF file will have one page (or more) for every point for which you have data under the field event

Print Field Logs from Field Data Page
- You can print the field logs by simply clicking on the field point or the well ID
- PDF log will have one page for each field point in the event
- You can also click on the Print Data button on top and select project, report, and event to print logs

Project Setup
| Create a new project |
| Add new forms |
| Upload field points in QNOPY |
| Upload default values |
| Adding Field Point Filters |
| Starting an Event from the Web |
Create Project
- To create a new project click on create project icon
 on the top right corner of my projects page
 - Enter the project name and hit Save
- Once the project is saved, you can do the following from the action button:

- Add/manage forms
- Add/manage users
- Add/manage field point filters
- Project folder
- Field points page
- Other settings – (this does not apply to all projects)
Add New Forms
- Click on my projects from the left menu
- Select edit project from the action dropdown next to the project name:

- Click on add form from actions:
Add/Upload Field Points
- Download the excel template for field points from the upload field points template option above
- Populate field points or monitoring wells with their latitude and longitude in the template and save
- To Add Field Points:
- Click on the plus button
 under the form for which you want to upload field points for
 - To upload field points in bulk click on
 Tab
Tab - Then upload the excel file by clicking on

- If any of the field points exists then you will see ‘LocationExist’ in the Action column. You can edit the name of the field point to make it unique.
- Once edited you can click on ‘Upload’ to add the field points to the project and selected form

Upload Default Values
- Download the excel template by clicking on the ‘Upload Default Values (pre-populated values) template‘ above
- Copy field points from the field points template
- Enter the values for casing material, casing diameter, pump intake depth (ft bmp) and screen interval in the respective columns
- Click on ‘Options’ button
 on Edit Project – Form and select “Defaults and Limits”
 - Select ‘Import from file’ option:

- Upload the excel template then click on ‘Save’
Adding Field Point Filters
- Field point filters can be accessed through Quick Links or the Project Details page. On the Project Details page, click on ‘Actions’ and navigate to the ‘Go to Field Point Filter’ option. Here, is a page identical to the page reached through Quick Links. To upload field point filters, click on the ‘Upload File’ button in the upper right-hand corner. Here, you can download the excel file template to upload, for example, sample frequency for your field points.
Starting an Event from the Web
- To create a new event on the web app, click on

- Select a project from the dropdown list
- Select a form you want to use for the fieldwork
- Name the event – naming an event is not mandatory. However, giving it a name helps to identify the event in the mobile app
- Event has a status:
 represents Active event and
  represents the closed or finalized event
 - You can perform the following actions by clicking on the
 button next to the event
- Rename or Name the event
- View field points associated with the event on a Map
- View field data (live data page)
- Print data – you can simply print PDF field logs for the whole event
- Go to the field point dashboard
QNOPY Tutorial Videos
Click here for tutorial videos
Want to give it a try?