One of the leading global environmental consulting firms that provides transaction support services for upstream oil and gas industry, has been using the QNOPY platform for last three and half years for managing their field inspections and reporting. QNOPY asset condition assessment application was configured to focus on oil and gas well inspections. QNOPY helped the client reduce the overall costs of the assessments by over 30% and increased the speed of completion by 50%. With streamlined field inspections program, the client is able to finish their projects faster and win more work.
Program Setup & Challenges:
- Fast paced projects – only 24 hours to get the project set up and put boots on the ground
- Assessment forms are partially filled with information from data rooms at the office
- Multiple site inspectors collaborate on the same asset – one inspector fills in the general information while other inspector inspects the equipments
- Pre-filled data along with general setup information need to be shown in the mobile app
- Inspectors need to see everyone’s data
- Asset locations need to be shown on a map with their completion status
- After the field visits, multiple reviewers need to edit the data
- Need the ability to mark items on a satellite map
QNOPY solution overview:
QNOPY created a custom solution for oil wells and related assets condition assessment. All the assets under a program are uploaded using the QNOPY field point upload module. Inspectors are granted access to the program and can access everyone’s data to avoid duplication of work. Web dashboards can be used to pre-fill any information available or gathered through data room research. Once completed, assessment reports can be downloaded in PDF, WORD, or EXCEL formats, for individual wells or as a batch export.
Mobile app:
Following are some of the key features of the mobile app:
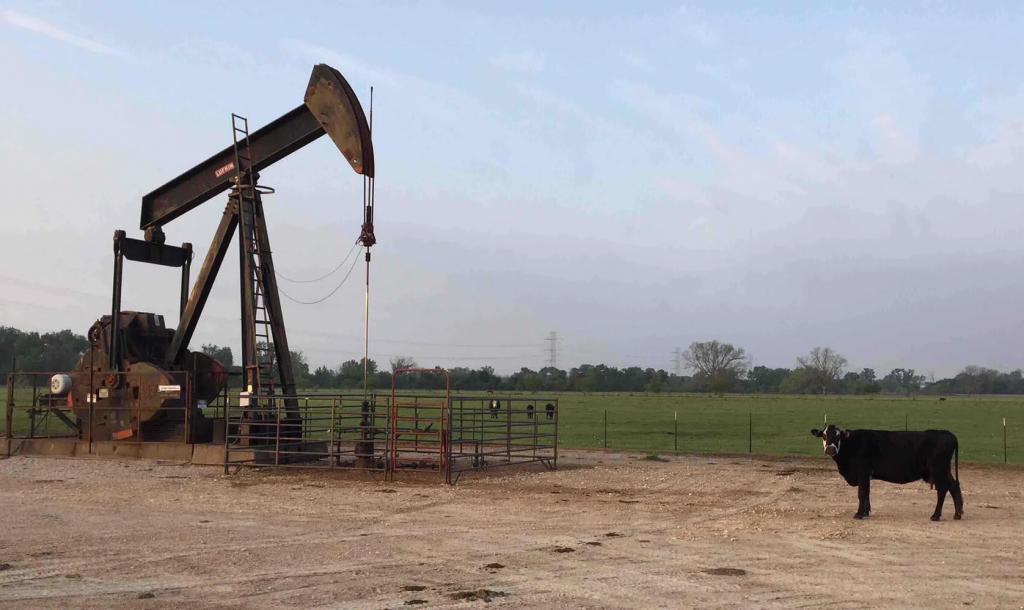
- Oil wells are added as field points under a program
- All the wells are shown on a map with their completion status – green are done and orange are incomplete
- Inspectors can see their current location on a map and see the well near them
- Things such as APN numbers, asset category, internal asset ID, and description are loaded into the QNOPY database as default values
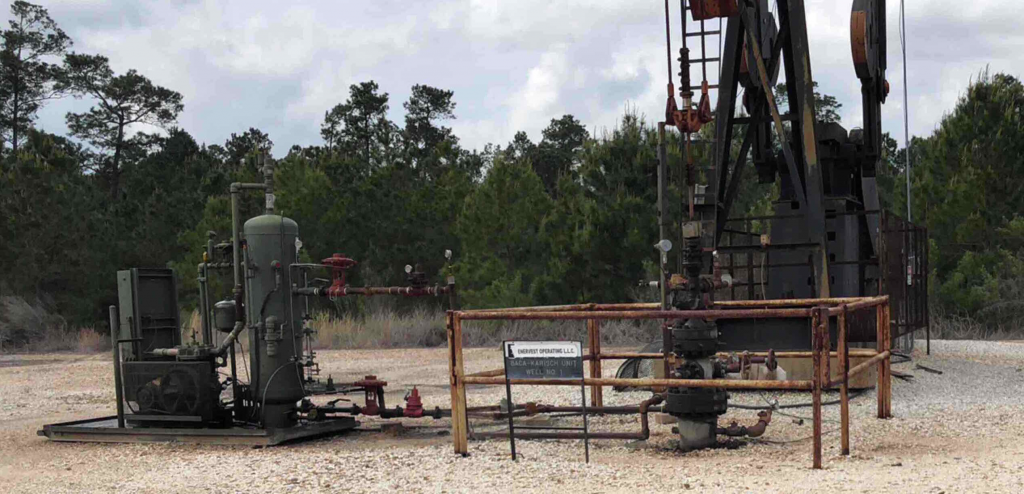
- Inspectors can select types of equipment on site and the app automatically creates form for each type of equipment for the inspectors to fill
- Any photos the inspectors take are automatically attached to the oil well and the location, timestamp, and oil well name are stamped on the picture as well
- Inspectors can capture multiple photos at a time and add caption for each picture
- Inspectors can also set up well template that they can simply fill into a form – as most of the wells have similar properties they can copy previously filled data to speed up the form data entry
Web dashboard:
- Project manager can add and remove users from the program
- Live data view shows all the data collected in a tabular format
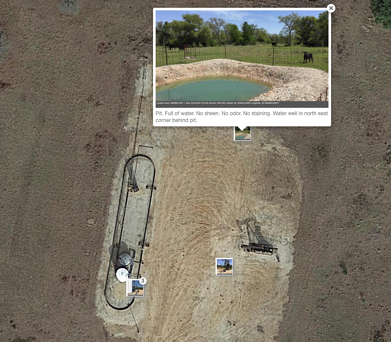
- View photos on a map. Photo locations are marked on a satellite map. Click on the photo to expand and view captions.
- Data can be edited in a tabular or a form view. All the changes to the data are saved to have a complete audit trail.
- Easy data editing in Excel: Inspection logs can be exported to an Excel file. Inspectors can make their edits in the excel file and simply import the file back into QNOPY.
- Printable reports for each well can be exported to Word or PDF from the Location dashboard
- Multiple or All of the well reports can be downloaded as a zip file
Results achieved:
- Over 100 assessment projects completed over last three years with zero data misplaced or lost
- Reduced cost of assessments by over 30% and helped win more similar projects
- Over 100 thousand assets and 150 thousand photos uploaded into the QNOPY platform
- Improved accuracy of the data
- No need to track photos manually. Enabled inspectors to take more photos and create better records
- Training fresh inspectors with the app became easier
- No more paperwork – saved time that would otherwise be spent on tracking and managing paper forms
- Data analytics showed trends that were not otherwise visible such as – 35% of the oil wells in a specific area had a specific type of spill problem or it takes 45 mins to complete a site visit in a specific area vs 30 mins in another area
To learn more: