Thousands of monitoring wells have been sampled with the QNOPY mobile app over the past four and half years. Field samplers like the intuitive user interface and the project managers like the reliability and the instant access to their data. QNOPY makes digitizing groundwater monitoring easy.
Here is what makes it stand out:
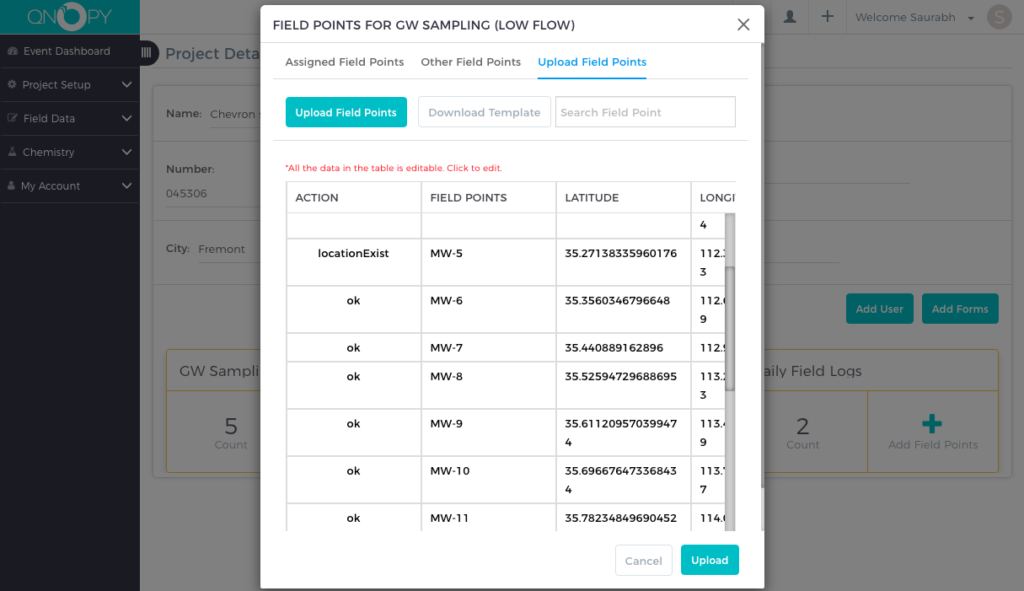
Fast Project Set Up
It takes less than 5 minutes to set up a new groundwater monitoring project. You can create a project with just a project name and add the address and project number. You can import your wells and also import validations and default values.
Locate Wells On a Map and Add a Profile Photo
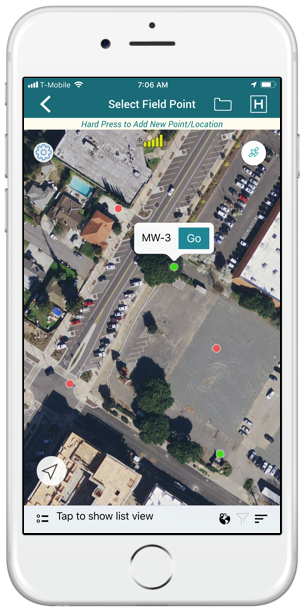
Any good groundwater data collection app or software should have a map view. You can view your wells in a list view or a Map view for better spatial awareness.
Any wells that have been sampled or have any data present show up as green dots.
You can add new monitoring wells by simply hard pressing on the map.
You can adjust the coordinates of a well and also add a profile picture to help locate a well. Watch how to add profile photo for a well.
You can set up filters such as Quarterly Sampling Plan or Offsite wells. App allows multiple filters such as Offsite wells with Quarterly sampling frequency.
Groundwater Well Integrity Check
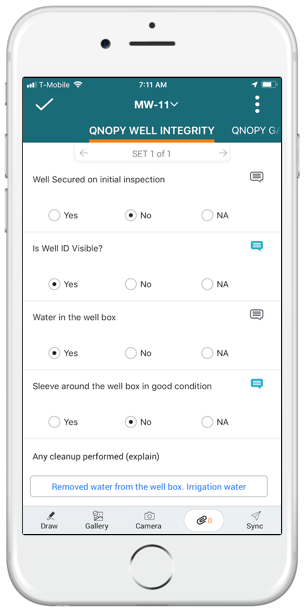
Its important to have the well box or a vault secured and well casing sealed. QNOPY app lets you record the condition of the well head with a few simple yes/no questions.
If something is out of the order or you want to add more detailed description, you can simply add a note for the question. As you can see in this picture, the notes icon turns blue if there is a note present. You can even attach photos to your note.
You can view historic well integrity notes to track all the repairs made to the wellhead or if there were any incomplete action items recorded for a well.
Historic Data and Validations for Groundwater Monitoring
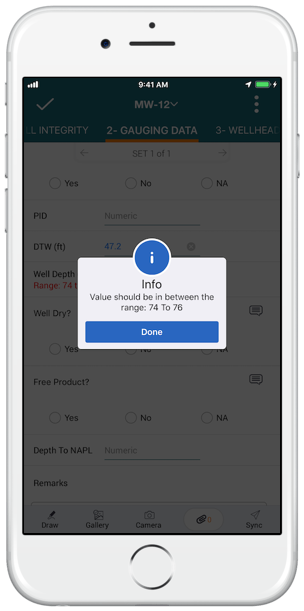
It’s useful to have access to the historic data while you sample a well. It helps to know that the parameters you are seeing are within a historic range.
QNOPY has a built in function for setting up historic data based validations. If at a particular well, ORP always ranged between 150-250, and if a sampler reads ORP of negative 120, the app will give a warning message; however, the sampler can still be outside the historic range.
Validations can be set up as warnings or as hard limits- not to exceed.
You can also set up default values for certain parameters such as Well Diameter or Total Depth of Well.
Automated Calculations and Stabilization
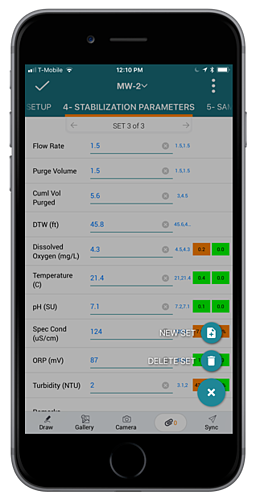
Juggling between field logs and calculators is always painful. With QNOPY App, you don’t need a calculator. Our groundwater monitoring app automatically calculates the height of the water column and converts it into gallons based on the casing diameter.
Parameter stabilization calculation feature give visual cues to the sampler to see if they have stabilization. You can record sets of readings every three to five minutes until you see all the numbers turn green.
The app calculates difference between last three sets of data. Following is a standard stabilization criteria used in the QNOPY app which can be changed for different states or clients:
- Ph +/- 0.1 units
- Conductivity +/- 0.3%
- Turbidity +/- 10% NTUs when >10 NTU
- DO +/- 0.3 units
- Temp +/- 2 degrees
- Salinity NA
- TDS NA
- ORP +/- 10 units
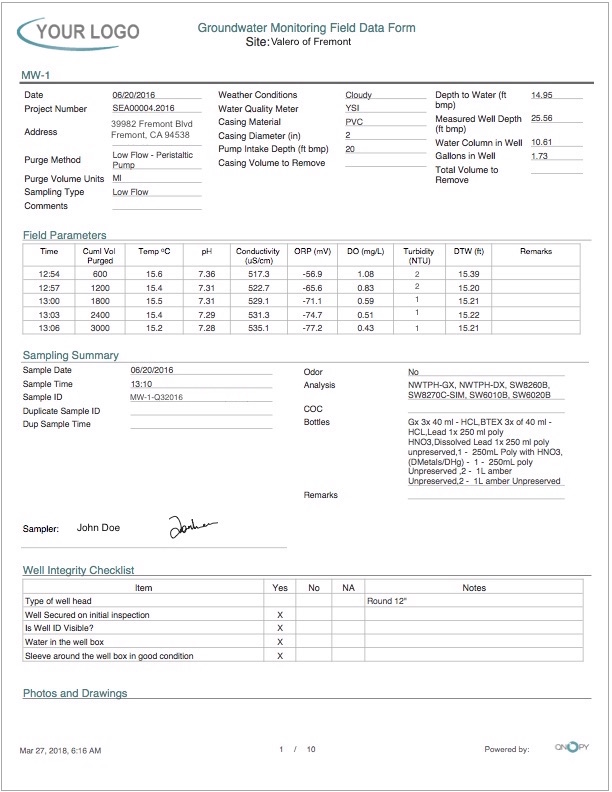
Export field logs to PDF or EDD
Data recorded in the field is available instantaneously over the web portal. You can print your field logs and save them as PDF, WORD, or Excel spreadsheets.
We can set up different EDD formats for exporting the data out of the QNOPY system. Raw data export can be used to bring the data into a GIS application.
You can make time series charts to view trends in your data and export the charts in PDF, PNG, or JPG formats.
You own your data and you will have access to your data over a secured web portal 24 hours a day and 7 days a week.